1. Introduction: The Intuitive Power of Decision Trees
If you look closely at the landscape of supervised machine learning, very few algorithms actually mimic how the human brain makes choices. The Decision Tree is the rare exception.
Famous for their visual, flowchart-like structure, decision trees are incredibly versatile. You can use them for classification tasks (like catching spam emails) just as easily as you can use them for regression tasks (like forecasting local real estate prices).
At its core, a decision tree relies on a concept called "recursive partitioning." This is just a fancy way of saying it takes a massive dataset and repeatedly chops it down into smaller, increasingly similar groups based on specific data points. Unlike deep neural networks—which often act as opaque, unreadable "black boxes"—decision trees give you absolute transparency. In high-stakes environments like healthcare diagnostics or loan approvals, stakeholders don't just want an answer; they want to know why. A decision tree lets you trace the exact logical path that led to a specific prediction.
2. The Anatomy of a Decision Tree
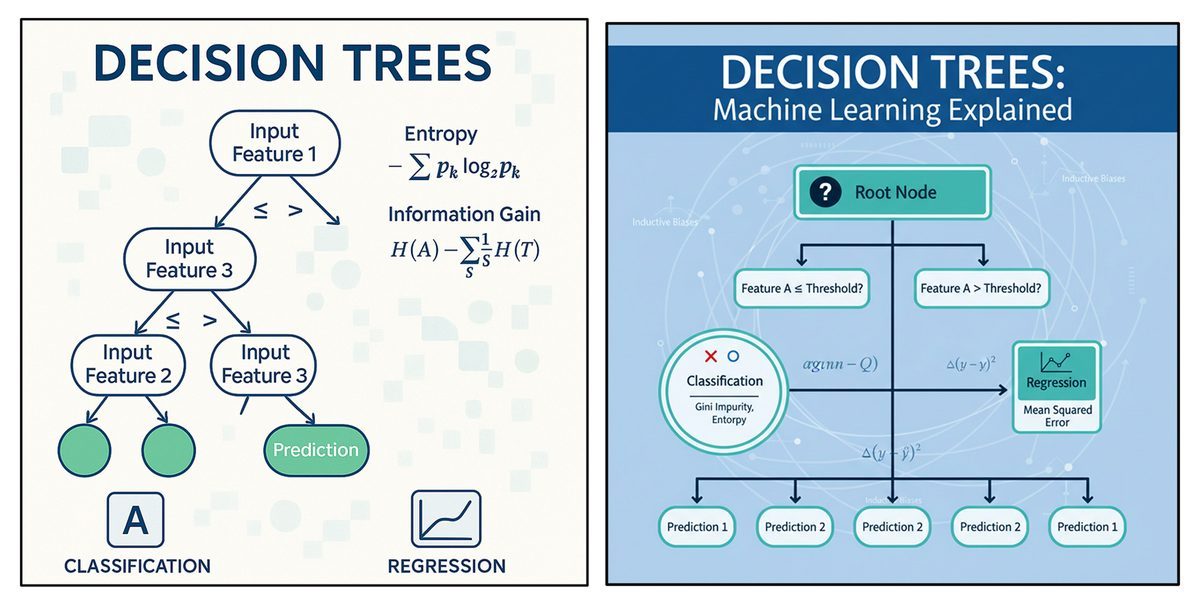
Think of a decision tree as an upside-down flowchart. It moves data from an initial, broad question down to a highly specific, final outcome using three main components:
The Root Node: Sitting at the very top, this represents your entire dataset before anything is split. It asks the very first question, evaluating the single feature that best separates your data right out of the gate.
Decision (Internal) Nodes: These are the midway points. Every decision node acts as a conditional test on a specific feature (for example: "Is Income > $50,000?"). Depending on the data's answer, it branches off further down the tree.
Leaf (Terminal) Nodes: These are the dead ends where the splitting finally stops. A leaf node holds your final prediction. In classification, it’s a category (like "Approve Loan"). In regression, it’s a specific number.
Imagine you are building a model to approve bank loans. Your root node might ask, "Is Income > $50,000?". If the applicant passes that check, they move down a branch to a new decision node: "Is Credit Score > 700?". A "Yes" lands them in a leaf node predicting "Approve Loan," while a "No" drops them into a "Reject Loan" leaf.
3. How the Algorithm Actually Builds the Tree
Trees don't just split data randomly. They use a systematic, top-down approach designed to maximize the "purity" of the data at every single step. The algorithm looks at all your features and tests different split points to find the absolute best way to divide the information.
To figure out what the "best" split is, the algorithm relies on specific mathematical criteria:
Gini Impurity
This metric calculates how often a randomly chosen element from your dataset would be misclassified if you randomly labeled it based on the distribution in that node. The formula is defined as:
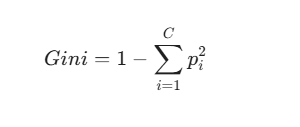
Where is the probability of an item belonging to class . The ultimate goal is to minimize this number. A Gini Impurity of 0 means the node is perfectly pure (e.g., everyone in that subset bought the product). If a node is perfectly split 50/50 between two classes, the impurity hits its maximum at 0.5.
Entropy and Information Gain
Borrowed from information theory, Entropy measures the disorder or unpredictability in your data.
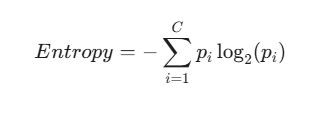
If a node is an even mix of "Yes" and "No," the entropy is high. If 95% of the data points say "Yes," the entropy drops.
Decision trees use a metric called Information Gain, which measures exactly how much the entropy shrinks after you split the data using a specific feature. The algorithm is greedy: it always chooses the feature that offers the highest Information Gain to reduce uncertainty as fast as possible.
The Recursive Process
Once that first perfect split is made, the tree simply loops. It applies the exact same mathematical process to the newly created child subsets. It only stops growing when it hits a roadblock—like when a node is 100% pure, when it runs out of features, or when it hits a maximum depth limit set by the developer.
4. Translating Trees into Interpretable Rules
One of the biggest selling points of a decision tree is its readability. Every single path from the root down to a leaf can be extracted as a simple IF-THEN rule.
Let's say you are predicting laptop sales based on user demographics. The tree's logic might look exactly like this:
Rule 1: IF Age < 30 AND Income = High THEN Buys_Laptop = No. Rule 2: IF Age = 31–40 THEN Buys_Laptop = Yes. Rule 3: IF Age > 40 AND Income = Low THEN Buys_Laptop = Yes.
Domain experts can instantly read these rules, validate if they make logical business sense, and easily hard-code them into standard business software.
5. Beyond Categories: Decision Trees for Regression
While they are famous for sorting things into categories, decision trees are remarkably good at regression—predicting continuous, floating-point numbers.
The architecture remains exactly the same, but the underlying math shifts. A regression tree doesn't care about Gini or Entropy. Instead, it wants to minimize prediction error. It typically does this by minimizing the Mean Squared Error (MSE):
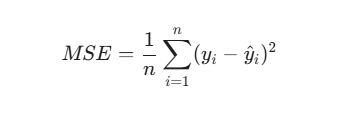
The algorithm hunts for the split that causes the largest drop in the variance of your target variable.
When the splitting stops, the leaf node doesn't give you a category. Instead, it outputs the average value of the target variables inside that subset. If a leaf node contains 10 houses with similar square footage, the model simply predicts the mean price of those 10 properties for any new house that lands in that node.
6. Key Characteristics and Strengths
Data scientists love decision trees for a few very practical reasons:
They Handle Mixed Data Naturally: Whether you have numerical data (Age > 30) or categorical text (Gender = Male), the tree handles it without requiring you to jump through complex encoding hoops.
No Feature Scaling Required: Algorithms like Support Vector Machines or k-NN rely on measuring physical distances between data points, meaning you have to rigorously normalize your data. Because trees just use threshold cutoffs, feature scaling is entirely unnecessary.
Non-Parametric Nature: Trees make zero assumptions about how your data is distributed. This allows them to easily map out highly complex, non-linear relationships.
7. Navigating the Pitfalls: Overfitting and Bias
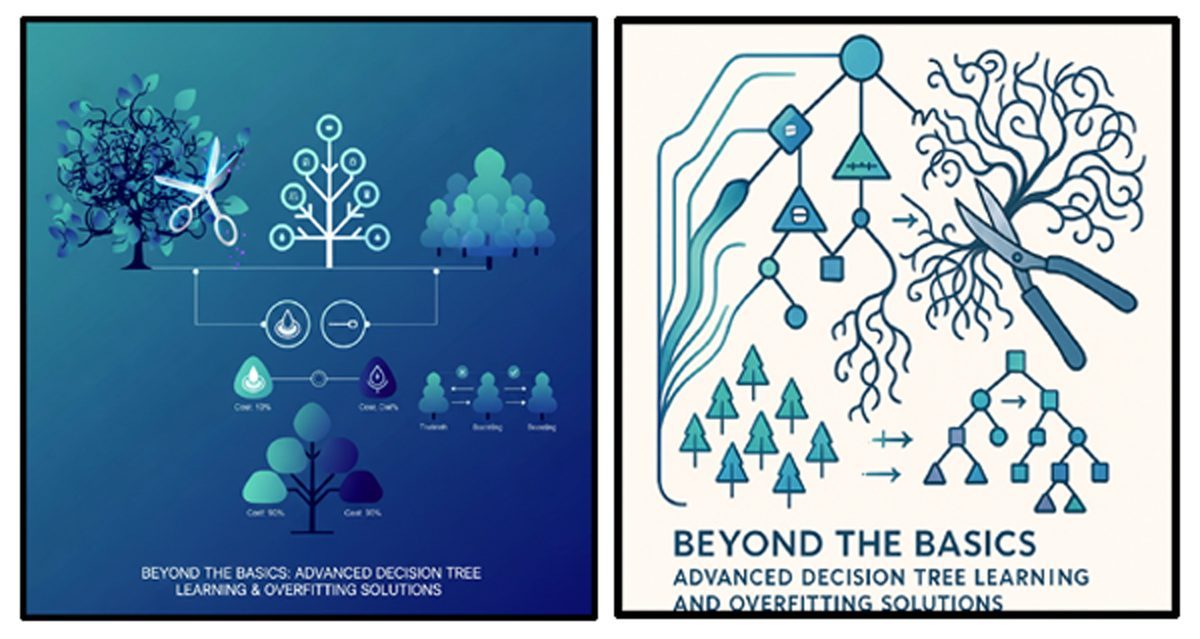
No algorithm is perfect. The Achilles' heel of the decision tree is its notorious tendency to overfit.
Because a tree can keep recursively splitting until it perfectly maps your training data, deep trees almost always end up memorizing random noise rather than learning actual patterns. When shown new data, they fall apart. To fix this, developers use "pruning" to cut away useless branches, or they upgrade to ensemble methods like Random Forests, which average out the predictions of hundreds of trees to stabilize the results.
Furthermore, decision trees can be accidentally biased toward features with lots of unique levels. For instance, it might prioritize splitting data by ZIP code over a genuinely predictive feature, simply because a ZIP code so easily shatters the data into tiny, pure subsets.
8. Understanding Inductive Bias in Decision Trees
To really master this algorithm, you have to understand its "inductive bias"—the built-in assumptions it relies on to make guesses about unseen data. Because there are infinite ways to build a tree, the algorithm is programmed to favor certain structures:
Occam's Razor: The algorithm naturally prefers shorter, shallower trees. It assumes that a simpler explanation is much less likely to overfit than a wildly complex one.
Greedy Splitting: The tree only looks at what is immediately in front of it. It finds the best split for the current node without planning ahead for future splits, assuming that great local decisions will add up to a solid global model.
Axis-Aligned Splits: Trees only evaluate one feature at a time. This means the decision boundaries it draws are always perfectly horizontal or vertical.
Conclusion
Decision Trees are a foundational pillar of modern machine learning. By transforming overwhelming datasets into clean, human-readable IF-THEN rules, they perfectly bridge the gap between heavy mathematical analytics and everyday business logic. Yes, you have to watch out for their tendency to overfit—but once you understand the math and the biases running under the hood, you can build incredibly robust systems. Whether you are filtering spam or valuing real estate, the decision tree is an indispensable asset in the data scientist's toolkit.